

How Public K-12 Schools Are Funded in the United States
Federal funding: smallest share, targeted purpose
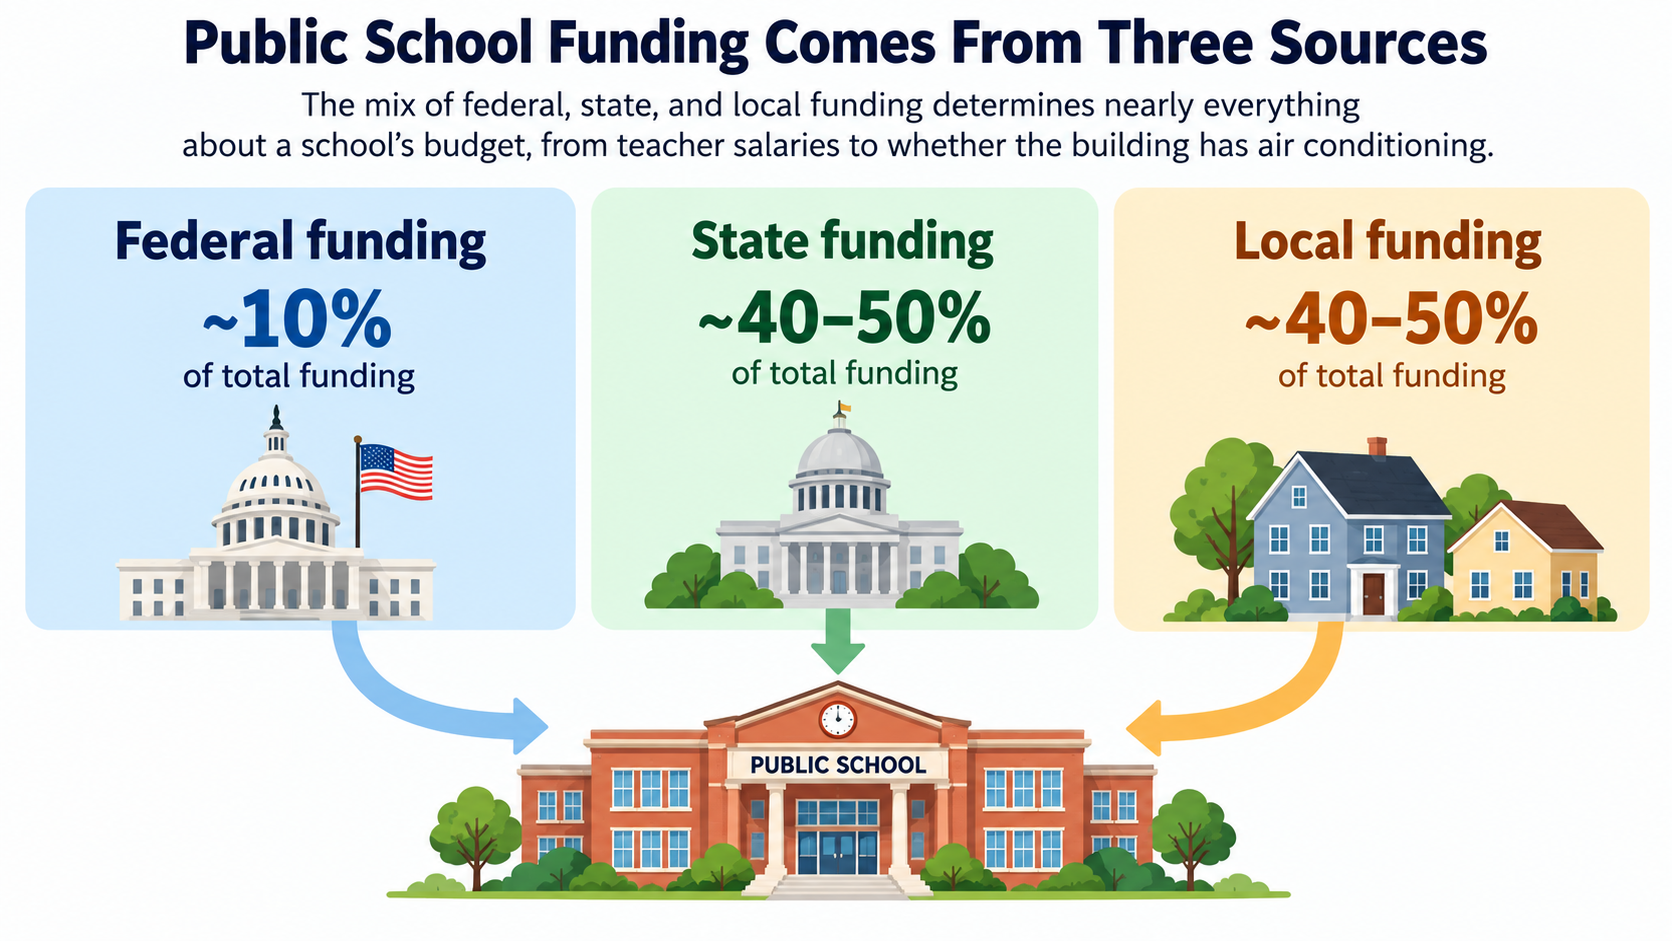
Federal dollars are the smallest piece, typically around 10 percent of the total. They're earmarked for specific goals. Extra aid goes to schools with many low-income students. Federal money also supports special education, school meals, and English-language instruction.
State funding: the equalizer
State funding is the next largest share, often close to half a district's budget. States distribute it through funding formulas. These are meant to send more money to poorer districts and less to wealthier ones, though results vary widely. Massachusetts is a success story. It tied state aid to student need in 1993 and required wealthier towns to contribute more, and achievement gaps narrowed markedly afterward. Illinois shows the opposite. A decade after the state moved to an evidence-based funding formula, most districts still fall short of their own targets. Poorer districts still tax property at double the rate of wealthier ones, yet still spend less per student.
Local funding: the biggest share, and the most unequal
Local funding is usually the largest share. It comes almost entirely from property taxes on homes and businesses in the district. This goes back to how the system was built: communities funded schools long before state or federal governments got involved. That history is also why local funding is the most unequal piece. It ties a school's resources to its neighborhood's wealth. A high-value district can raise a lot of money at a modest tax rate. A lower-income district may tax residents more and still bring in far less per student. State formulas are meant to close that gap. They rarely close it completely.
For example, Palo Alto and East Palo Alto sit a few miles apart in California, split by Highway 101. In 2015-16, Palo Alto Unified spent about $17,900 per student. Ravenswood City School District, serving East Palo Alto, spent about $15,600. That gap held even though the state formula was meant to send Ravenswood's high-poverty student body extra money. The underlying divide is income: median household income is about $136,500 in Palo Alto and about $52,000 in East Palo Alto. That gap feeds directly into each city's property tax base.
Why this matters for civic engagement
About 90 percent of funding comes from local and state sources. So spending per student can vary a lot, even between neighboring districts. That's why school funding fights play out mostly in local politics. School board elections, property tax levies, and state budget debates decide funding more than anything in Congress. This can genuinely surprise communities newer to a district or state, including many South Asian American families used to more centralized systems elsewhere. It's worth understanding, especially before deciding where to direct a vote or a question.
Figures are general averages; they vary by year and state, so check your state education agency or local school board for exact numbers.